-
- Contact Us
- Privacy Policy
- term and condition
- Cookies policy

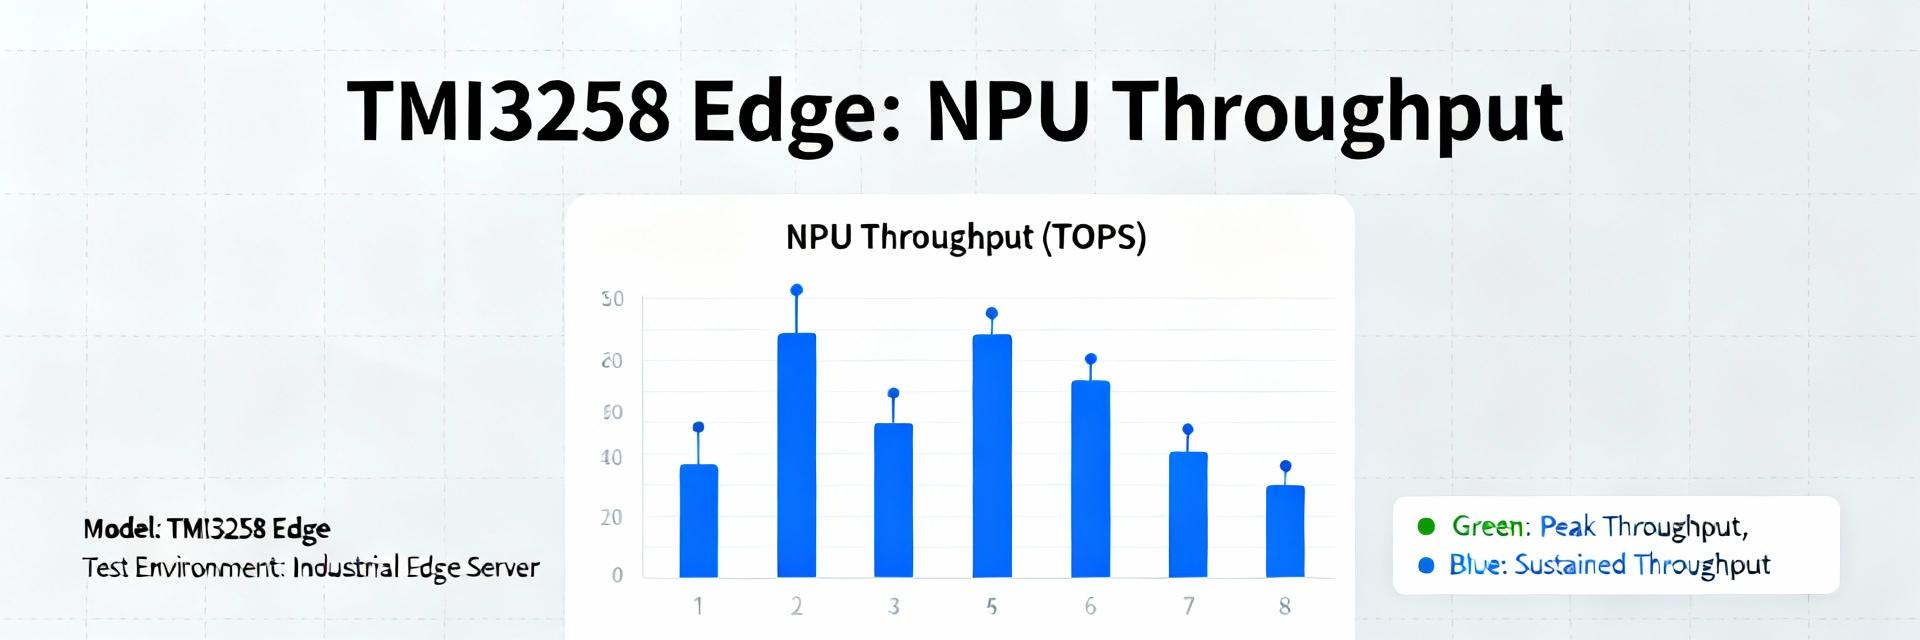
TMI3258 in Edge Devices: Real Benchmarks from Field Tests
21 January 2026
0
Related articles
-
 Resistor Market Pulse: Key Metrics & Component Usage2026-05-12 10:15:23 0A strategic analysis of global trends, demand catalysts, and procurement benchmarks. The current snapshot shows the resistor market positioned between a steady-demand cycle and pockets of rapid volume growth, with estimated global TAM ranges indicating mid-single-digit short-term CAGR and shipment swings tied to automotive electrification and industrial automation. Near-term demand drivers are expected to favor automotive and industrial control applications, supporting moderate ASP resilience even as commodity segments face price pressure. This article explains how the resistor market is moving, which key metrics to track, and how component usage differs by end market, giving engineers and procurement teams a concise, data-first playbook for decisions and risk mitigation. 01 Resistor Market Overview — scope, segments, and market size context Market scale & growth drivers Estimated total addressable market ranges vary by source, but a practical working range for near-term planning is a low‑billion to low‑ten‑billion USD global TAM with short‑term CAGR in the mid-single digits. Primary demand catalysts: 1) Automotive electrification and ADAS: modules increasing resistors per vehicle. 2) Industrial automation: growth in motor drives and robotics. 3) IoT & Consumer: replacement cycles and device miniaturization. 4) Telecom: infrastructure refresh for 5G and beyond. 5) Medical: high-precision parts for advanced diagnostic devices. Market segmentation by product & form factor Resistor types and packaging divide market economics: chip resistors dominate unit volumes, metal‑film and precision families command higher ASP, wirewound serve power applications, and pulse/protection resistors occupy specialized niches. SMD packages account for the majority of new designs; through‑hole remains for legacy and high‑power segments. Type Typical Specs Common Applications Chip (thin/thick film) 0201–1206, 0.1%–5% tol, 0.0625–0.25W Mainstream consumer, telecom, power sensing Metal‑film / Precision 0.005%–0.1% tol, low TCR Instrumentation, medical, precision ADC front‑ends Wirewound High power, low ohm to kΩ Power supplies, motor drives, sensing 02 Data Deep‑Dive: Key Metrics to Track Core KPIs: shipments, ASP, unit volumes, and ASP trends Define and monitor these core KPIs: TAM (revenue potential by segment), unit shipments (volume flow), average selling price (ASP) by family, inventory days (distributor and OEM), and on‑time fill rate. Sample benchmarks for planning: shipment growth ±5–15% in hot segments, ASP drift of ±2–10% depending on commoditization, inventory days target 30–90 depending on lead time. Interpreting shifts: falling ASP with rising shipments suggests commoditization; rising ASP with stable shipments often signals supply tightness or premium mix shift. Supply‑side indicators & price drivers Supply levers to watch include raw material costs (resistive alloys, ceramics), capacity utilization rates, wafer/wafer‑equivalent throughput for thin film, and lead time trends from fabs and assembly. Indicator Green (Stable) Amber (Caution) Red (Risk) ASP Movement Stable ±5% swing ↓ >10% or ↑ >10% Lead Time (weeks) ≤8 8–16 >16 Capacity Utilization >80% 60–80% Component Usage Patterns Across End Markets Usage by sector: automotive, industrial, consumer, telecom, medical Average resistor counts and mix vary widely: a modern EV powertrain and ADAS suite can add hundreds of resistors per vehicle across sensing and power modules; an industrial control panel typically uses dozens to a few hundred higher‑power parts; consumer smartphones use hundreds of chip resistors per device but skew to lowest‑cost thin/thick film. Key Examples: 1) ADAS sensor boards: demand precision metal‑film for ADC front ends. 2) Motor drives: require wirewound/high‑power resistors for braking and sensing. Usage by specification: tolerance, power rating, and precision needs Selection follows function: high precision (0.01%–0.1%) and low TCR for measurement paths; 1%–5% general‑purpose for signal conditioning; >0.5W ratings and wirewound for power dissipation. Checklist: define accuracy and TCR targets, estimate worst‑case power dissipation plus derating, select package compatible with assembly and thermal path. Design & Sourcing Best Practices Engineering Checklist Quantify accuracy and TCR needs. Calculate steady‑state and transient power with derating margin. Choose tolerance band that meets system budget without over‑specifying. Require thermal and mechanical stress tests. Document acceptable alternates to avoid BOM lock-in. Procurement Tactics Rationalize part families to common footprints (0201–0805). Implement multi‑sourcing for high‑risk items. Set safety stock based on lead time variability. Define KPI targets: lead time ≤12 weeks, fill rate ≥95%. Actionable Recommendations for Stakeholders For manufacturers & distributors: Prioritize precision and automotive‑qualified families, invest in testing capacity and traceability, and scale SMD throughput. Develop data‑driven digital channels for rapid quoting. For designers & buyers (6‑point checklist): 1) Monitor core metrics monthly; 2) Right‑size tolerances; 3) Plan obsolescence mitigation; 4) Pre‑qualify alternates; 5) Standardize footprints; 6) Track supplier lead times. Executive Summary The resistor market remains demand‑driven with mid‑single‑digit CAGR pockets, led by automotive electrification and industrial automation. Core key metrics to track are unit shipments, ASP by family, inventory days, and on‑time fill; early shifts signal supply stress. Immediate actions: rationalize footprints, qualify alternates, and run a parts rationalization review this quarter to optimize cost. Frequently Asked Questions What are the most important key metrics for tracking resistor supply risk? Focus on unit shipments, ASP trends by resistor family, distributor inventory days, and supplier lead times. Combine those with capacity utilization signals from producers and raw‑material cost indicators. How should designers translate component usage needs into resistor specifications? Start with system accuracy and power budgets: define required tolerance and TCR, calculate worst‑case dissipation and apply derating, then choose package and material. Validate with thermal and reliability tests. What procurement tactics reduce shortage and price volatility for resistors? Adopt part family rationalization, multi‑sourcing for critical SKUs, safety stock calibrated to lead time variability, and regular supplier qualification windows. Maintain prioritized alternates and enforce procurement KPIs.READ MORE
 -
 Resistor Reliability Report: Specs, Types & Metrics2026-05-10 10:15:22 0Introduction — Point: Recent lab and field analyses indicate resistors account for a notable share of passive-component failures in harsh environments, affecting uptime and safety. Evidence: Aggregated reliability studies and accelerated life testing summaries show elevated drift, opens, and solder-joint issues under combined thermal and humid stress. Explanation: This report condenses actionable metrics, spec-reading guidance, and selection rules so engineers and purchasers can reduce field returns and safety risks. Introduction — Point: The goal is practical: translate test outputs and datasheet entries into margined designs. Evidence: Cross-study comparisons and procurement case histories reveal simple derating and required ALT evidence lower in-field failure rates. Explanation: Readers will gain stepwise checks, calculation templates, and a compact checklist to improve service life without speculative multipliers. 1 Why resistor reliability matters (background) 1.1 Key failure modes and system impact Point: Resistor failures present as open circuits, shorts, resistance drift, tolerance shifts, thermal runaway, and mechanical fracture. Evidence: Field returns and board-level fault analyses commonly attribute signal degradation, power loss, and safety trips to these modes. Explanation: Understanding dominant modes by application class—precision analog, power, pulsed—lets teams specify acceptable failure consequences and mitigation (redundancy, derating, monitoring) early in the design. 1.2 Relevant specs that predict reliability Point: Datasheet items that most closely correlate with long life are rated power, maximum working voltage, TCR, tolerance, derating curves, thermal resistance, and moisture sensitivity indicators. Evidence: Comparing stressed-population ALTs with nominal ratings shows margin directly affects drift and open-fail incidence. Explanation: Use power stress = applied power / rated power and consult derating curves to set design margins; request explicit resistor specs for thermal and humidity limits during procurement. 2 Resistor reliability: field & lab data deep-dive 2.1 Failure-rate benchmarks and comparative datasets Point: Commonly reported metrics include MTTF and FIT and distributions of failure modes by environment. Evidence: Published reliability handbooks and aggregated ALT summaries recommend presenting ranges (e.g., orders of magnitude) rather than single-point rates to avoid overconfidence. Explanation: Report FIT ranges per stress category and present a comparison table by temperature, humidity, and vibration to inform component selection and acceptance criteria. 2.2 Environmental stress effects: temp, humidity, vibration, and surge Point: Each stressor accelerates different failure physics: humidity promotes corrosion and drift; thermal cycling drives solder and bond fatigue; vibration causes mechanical fracture; surge and pulses induce overheating or substrate damage. Evidence: Correlated ALT logs show mode-specific clusters under targeted stress profiles. Explanation: Design ALTs to isolate stresses, then map observed modes to field monitors for predictive maintenance planning. 3 Metrics and calculations every designer should master 3.1 MTTF, FIT, and ALT Basics Point: MTTF and FIT quantify expected failure frequency; ALT bridges accelerated conditions to field life. Evidence: A valid workflow defines failure criteria, captures time-to-failure distributions, and uses conservative extrapolation assumptions. Explanation: Use a checklist—representative stress profile, adequate sample size, run-in, clear failure definitions, and documented logging—to ensure ALT outputs are trustworthy for life estimates. 3.2 Derating & Thermal Power Point: Power-stress calculation and derating are the most direct reliability levers. Evidence: Extract thermal resistance, rated power, and derating curves from resistor specs to compute junction/ambient delta and applied fraction of rating. Explanation: Calculate power stress = (I^2·R)/rated power, apply required margin per application class, and verify using thermal resistance and PCB thermal design to avoid repetitive thermal excursions. 4 Resistor types and their reliability profiles 4.1 Common resistor technologies Point: Different constructions yield distinct reliability trade-offs. Evidence: Comparative data and failure-mode studies show wirewound excels in pulse and power, metal-oxide resists thermal drift, thin-film offers low TCR for precision, and carbon shows higher noise and humidity sensitivity. Type Strengths Weaknesses Thin/metal film Low TCR, precision Lower pulse capacity Wirewound High power, pulse Inductive, size Metal-oxide Thermal stability Moderate noise Carbon Low cost Humidity sensitivity, drift 4.2 Specialized resistors: high-power, precision, pulse, and high-voltage Point: Specialized parts use substrates, metallization, and packaging to extend life in niches. Evidence: Life-test summaries for high-power and high-voltage variants show improved survival when matched to intended stressors and derated appropriately. Explanation: Choose specialized resistors when standard parts cannot meet derating or pulse requirements; require manufacturer ALT summaries and batch traceability during procurement. 5 Testing, qualification, and standards 5.1 Recommended test protocols and ALT design Point: Effective ALT setups include thermal cycling, power cycling, humidity with bias, surge/pulse testing, and mechanical shock/vibration. Evidence: Protocols that specify sample size, run-in, and objective failure criteria produce reproducible data for acceptance decisions. Explanation: Document ALTs with clear data-logging, failure analysis plans, and statistically supported sample counts to translate results into procurement acceptance limits. 5.2 Standards and handbook references to cite Point: Standards provide test-method templates and threshold guidance for acceptance. Evidence: Industry and military reliability handbooks list stress profiles, test fixtures, and mapping guidelines for component-level qualification. Explanation: Reference standard parameter thresholds when defining resistor specs required in POs—include derating, maximum working voltage, and humidity test levels as explicit contractual items. 6 Practical checklist 6.1 Spec-sheet and sourcing checklist for purchasers and engineers Point: A concise procurement checklist reduces ambiguity and failure risk. Evidence: Best practice lists include required derating, TCR limits, tolerance, power and surge ratings, environmental qualification, ALT evidence, and lot traceability. Explanation: Include explicit PO clauses requesting batch ALT summaries, life-test evidence, and return-material authorization terms to align supplier deliverables with design assumptions. 6.2 Design and assembly best practices to reduce failures Point: PCB and assembly decisions materially affect resistor life. Evidence: Thermal vias, generous copper pour for heat dissipation, correct solder profiles for SMDs, and controlled handling reduce thermal and mechanical stress-related failures. Explanation: Specify reflow profiles, recommend conformal coating for humid environments, and instrument field units to log temperature and event counters for condition-based maintenance. Summary Prioritize datasheet-derived margins: use resistor specs to set derating and thermal budgets; require ALT evidence during sourcing to validate longevity under intended stresses, reinforcing better resistor reliability. Match resistor types to application stresses: choose thin- or metal-film for precision, wirewound for power/pulse, and ceramic-substrate for harsh environments to reduce mode-specific failures. Adopt standard ALT protocols and procurement clauses: specify test profiles, sample sizes, and failure criteria so design margins are backed by measurable life estimates and traceable supplier data. FAQ How should engineers use resistor specs to predict reliability? Use point-estimates from datasheets—rated power, derating curve, TCR, thermal resistance—to compute power stress and junction rise. Require supplier ALT summaries that mirror your stress profile and apply conservative margins; incorporate these numbers into acceptance criteria and preventive-replacement schedules. Which resistor types are best for high-power, high-reliability applications? Wirewound and ceramic-substrate high-power variants generally offer superior pulse handling and thermal robustness. For precision power applications, select parts with documented surge ratings and low TCR; always confirm with ALT evidence under representative application loading. What minimal ALT evidence should procurement request for critical resistors? Request a concise ALT summary showing test conditions, sample size, failure criteria, time-to-failure distribution, and corrective-action notes. Include batch traceability and a statement that test stresses reflect expected field temperature, humidity, and power profiles. Technical Reliability Analysis © 2023 Resistor Industry ReportREAD MORE
 -
 0603 1K 1% Resistor Market: Availability & Pricing2026-05-05 10:24:16 0Current inventory snapshots and pricing scans across US distribution channels show fluctuating availability and a 10–30% range in unit price for the 0603 1K 1% resistor depending on volume and film type. This volatility creates urgency for purchasers and designers to reassess short-term buys and BOM resilience. The goal of this article is to equip engineers and procurement teams with practical signals, pricing drivers, substitution guidance, and immediate steps to secure supply. Using distribution and EMS signals, plus small-sample procurement checks, the analysis focuses on actionable KPIs and tactics rather than vendor-specific listings. Expect concise checklists, a price-by-volume snapshot, and procurement formulas suitable for US engineering teams managing SMD resistor availability and cost. 1 — Why the 0603 1K 1% resistor matters in modern SMD designs Technical specs to highlight Point: Designers must verify electrical and mechanical specs before selecting a part. Evidence: Datasheets typically present tolerance, power rating, TCR, film type, maximum operating voltage, and solderability. Explanation: For 0603 footprints, confirm 1% resistance precision, typical power rating (~1/16 to 1/10 W depending on manufacturer), and TCR (ppm/°C) for precision applications; thin-film parts often deliver lower TCR and noise than thick-film alternatives. Common applications and design constraints Point: The 0603 1K 1% resistor is common in precision sensor front-ends, ADC input networks, and pull-up/pull-down arrays. Evidence: Engineers choose 1% tolerance when ADC resolution or offset budgets demand low resistance error. Explanation: When thermal dissipation or surge currents exceed 0603 capability, consider larger packages (e.g., 0805) or parallel resistors; footprint density, reflow profile, and placement reliability also influence suitability. 2 — Current availability & pricing trends (Data analysis) Availability signals to monitor Point: Monitor inventory levels, lead times, MOQ changes, and temporary backorders as leading indicators. Evidence: Distribution snapshots and EMS supplier reports commonly show SKU stock percentages and lead-time flags; procurement checks reveal differences between “in-stock” and “available to ship.” Explanation: Track days-of-supply, percent of SKUs with lead times >8 weeks, and any MOQ increases. For designers, a single at-risk precision part on a critical net can warrant a short-term buffer. Pricing drivers and recent price behavior Point: Price varies by film type and order volume. Evidence: Market scans show thick-film 0603 units priced lower per piece than thin-film equivalents, with steep volume discounts above typical breakpoints. Explanation: Raw material costs, freight and FX swings, MOQ policy, and board-level demand cycles drive 10–30% unit price swings; use volume tiers when planning buys. Order size Thick-film ($/pc) Thin-film ($/pc) 1,000 $0.020 $0.050 10,000 $0.008 $0.020 100,000 $0.004 $0.010 3 — How to assess SMD resistor availability for your BOM Sourcing and validation checklist Checklist (annotated): verify exact tolerance and TCR fields; confirm power rating and voltage rating; match film type (thin vs thick); confirm reel packaging and marking; validate shelf-life and storage; pre-qualify 2–3 equivalent manufacturers. Point: Substitution requires strict field matching. Evidence: Datasheet equivalence is the primary validation method. Explanation: For acceptable substitutes, ensure tolerance, TCR, power rating, temperature range, and failure modes are equivalent; mismatched film type can require additional bench validation. Inventory planning & ordering tactics Point: Use a simple reorder-point formula and tactical buys to manage risk. Evidence: Common formula: Reorder point = Lead time (days) × Daily usage + Safety stock. Explanation: Example — if daily usage is 50 pcs and lead time is 21 days, reorder point = 21×50 + safety stock (e.g., 500) = 1,550 pcs. Tactics include staggering reorders, small safety buys to cover immediate needs, and consolidated buys for discounts. 4 — Substitutes and technical trade-offs When to substitute and acceptable compromises Point: Thin‑film offers lower TCR and noise, thick‑film gives cost advantage. Evidence: Bench tests typically show thin‑film stability and lower drift under thermal cycling. Explanation: Substitute thick‑film for non-critical signal paths or where downstream calibration compensates; avoid substitution in precision front-ends or where temperature sensitivity matters without validation testing. Package and value alternatives Point: Alternatives include changing package size or using parallel resistors. Evidence: Moving to 0805 can improve dissipation; paralleling two 0603 units lowers effective resistance and increases power handling. Explanation: When switching parts, update BOM control, CAD footprints, and assembly instructions; enforce version control and requalification steps in release management. 5 — Immediate action plan for engineers and buyers Quick Wins (Short Term) Prioritize footprint-compatible alternates, place targeted small safety buys, batch multiple SKUs into single POs, and pre-qualify 2-3 vendors per critical part. Policy Changes (Long Term) Add dual-sourcing mandates, maintain a preferred-alternate matrix, include sourcing risk in design reviews, and track lead-time/cost KPIs over time. Summary Market snapshot: the 0603 1K 1% resistor shows variable availability and price sensitivity to film type and order volume; short-term buffers and active monitoring reduce disruption risk. Procurement checklist: verify tolerance, TCR, power rating, film type, and packaging; pre-qualify alternates and ensure reel/marking compatibility before substitution. Cost tactics: use volume-tier buys, staggered reorders, and consolidated POs; test thin‑film vs thick‑film substitutes for noise and drift before production changes. 6 — FAQ What affects 0603 resistor availability and pricing most? Availability and pricing respond mainly to film type (thin vs thick), order volume, raw material and freight costs, and sudden demand shifts. Track lead-time flags, MOQ changes, and percent of SKUs with lead times beyond your acceptable window to anticipate cost or supply impacts. Can I substitute a thick‑film 0603 for a thin‑film part? Substitution is possible for non‑critical circuits if tolerance, power rating, and TCR are acceptable. Always bench-test for noise and thermal drift and run thermal cycling when the resistor sits in precision signal paths; update BOM records and requalification notes after validation. How should I size safety stock for resistors on a tight schedule? Use the reorder-point formula: lead time × daily usage + safety stock. Adjust safety stock based on supplier reliability and criticality; for single-source critical parts, increase safety buffer and consider staggered buys or consignment options to smooth supply.READ MORE
 -
 0603 20kOhm 1% resistor: Supply, Specs & Pricing Guide2026-04-30 10:17:17 0Market snapshot: recent distributor-stock indexes and internal procurement scans show oscillating availability for small SMD resistors — short lead-times one quarter, constrained reels the next — forcing faster buy decisions in high-volume designs. For engineers and buyers focused on precision SMD parts, this guide breaks down what to check on a datasheet, current supply signals to watch, and the practical pricing bands and sourcing tactics for a 0603 20kOhm 1% resistor. Purpose and scope: this US-focused, numbers-first guide is written to help procurement teams and PCB designers evaluate specs, interpret supply metrics, and estimate landed pricing for prototype and production buys. It prioritizes actionable steps and checklist fields you can copy into RFQs and BOM notes. (Background) — What is a 0603 20kOhm 1% resistor? Physical and electrical basics Point: The 0603 footprint (imperial 0603 / metric 1608) is a standard SMD size optimized for automated assembly. Evidence: typical datasheets list nominal power dissipation at ~0.1 W (1/10 W), tolerance ±1%, and common TCR ranges from 50 to 200 ppm/°C depending on thin- vs thick-film construction. Explanation: check rated voltage (often 50–200 V depending on dielectric and construction) and follow vendor derating guidance — voltages approaching the rated limit increase noise and drift risk. Packaging is commonly cut tape, ammo box, or full reel; confirm reel quantity and orientation for pick-and-place. Typical applications Point: 20 kΩ at 1% tolerance is a common choice where moderate impedance minimizes leakage and preserves signal integrity. Evidence: designers use 20 kΩ in pull-ups, bias networks, divider legs, and low-pass RC filters where higher resistance reduces current draw without introducing excessive noise. Explanation: 1% tolerance matters in calibration and precision analog circuits to maintain predictable divider ratios and offset performance; if TCR or drift is critical, select parts with lower ppm/°C or thin‑film construction. 1 (Data Analysis) — Current supply landscape Stock, lead-time and availability trends Point: Availability fluctuates with order size and packaging. Evidence: typical patterns show short lead-times (days) for piece/samples, moderate lead-times (1–4 weeks) for small reels, and extended lead-times for production reels during seasonal peaks. Explanation: procurement should expect lead-time variance by MOQ; request current inventory snapshots when comparing quotes and plan alternates when reels appear constrained. Key factors affecting supply Point: Multiple upstream and demand-side drivers affect supply. Evidence: production capacity differences between thin-film and thick-film lines, raw-material constraints, and surge demand from adjacent sectors (consumer, automotive) cause availability swings. Explanation: procurement signals to track include MOQ vs on-hand stock, lead-time alerts from major suppliers, and cross-reference counts; these help decide when to qualify alternates or place safety stock. (Data Analysis) — Pricing trends and expected price bands Point: Unit price is highly quantity- and packaging-dependent. Evidence: practical bands — single-piece/sample buys can cost several cents each once handling is included; small reels (100–500 pcs) typically fall into low fractions of a cent to a few cents per unit; full production reels (1,000–10,000+) deliver the lowest per-piece cost. Order type Typical qty Price band (USD/pc) Sample / single piece 1–10 $0.02–$0.10 Small reel 100–500 $0.005–$0.02 Full reel 1,000–10,000+ $0.001–$0.005 Explanation: always confirm if price quotes assume tape-and-reel handling; converting sample pricing to reel economics clarifies real production cost. Market forces that move prices Point: Several levers shift pricing. Evidence: volume discounts, material-cost inflation, freight & tariffs, and seasonal demand spikes can swing per-unit cost by multiples. Explanation: compute landed cost = unit price + freight + duty + handling + expected scrap to fairly compare quotes; include assembly yield impact when evaluating cheapest per-unit options. (Method Guide) — Choosing the right resistor Datasheet checklist: must-check parameters Point: A focused datasheet review avoids downstream failures. Evidence: verify resistance tolerance, power rating, TCR (ppm/°C), rated voltage, operating temperature range, solderability, moisture sensitivity, end-termination finish, and recommended reflow profile. Explanation: acceptable thresholds: TCR ≤100 ppm/°C for many analog circuits; power rating ~0.1 W for 0603; confirm reflow profile for your assembler to avoid delamination. Practical selection tips for manufacturing Point: Match construction to application. Evidence: thin-film parts usually offer lower noise and better stability; thick-film is cost-effective for general purpose. Explanation: choose packaging for your assembly line (tape-and-reel for pick-and-place), evaluate conformal-coating compatibility for high-humidity environments, and pre-qualify solderability if wave or selective soldering is in your process. (Case / Procurement Strategies) — Sourcing strategies Prototype & small-batch Point: Reduce MOQ friction while validating fit. Evidence: typical flow — confirm footprint, order samples or short cut-tape runs, test solderability and tolerance on a small pilot run, then qualify for production. Explanation: cut-tape or split-reel options reduce upfront cost; log sample lot codes and test results to speed later vendor qualification. Production procurement Point: Production needs redundancy and documented alternates. Evidence: best practice — qualify multiple cross-referenced part numbers, maintain safety stock equal to several production weeks, and negotiate blanket orders with accelerate clauses. Explanation: practical minimum: qualify at least 2–3 alternate manufacturers or equivalent PNs for key resistor values and record cross-qualification in the BOM with approved lot test criteria. (Actionable Checklist) — Quick Pre-purchase Checklist Confirm footprint and land pattern; verify 0603 orientation for placement. Verify power rating (~0.1 W), tolerance ±1%, and acceptable TCR. Check packaging, MOQ, reel qty, and request a reel sample if needed. Estimate landed cost (unit + freight + duty + handling + scrap). Confirm lead time and plan at least one qualified alternate PN in BOM. Cost-saving and negotiation tactics Point: Negotiate on total cost and flexibility. Evidence: tactics include consolidating buys across values, buying full reels when feasible, requesting multi-year pricing for forecasted volumes, and asking for split-reel quotes for prototypes. Explanation: track KPIs such as price per 1,000 pcs, lead-time reduction targets, and available stock-hold options to measure supplier responsiveness. Summary Evaluate specs first, then manage supply and pricing with clear procurement signals: confirm datasheet fields and TCR, compare landed costs across packaging and order sizes, and qualify alternates before placing production reels. In short, treat a 0603 20kOhm 1% resistor as a precision commodity — specs, supply, and pricing together determine product reliability and cost. Key summary Datasheet essentials: verify ±1% tolerance, ~0.1 W power rating, TCR (≤100 ppm for precision), rated voltage and reflow profile before approval. Supply signals: monitor MOQ vs on-hand stock and lead-time alerts; qualify 2–3 alternates and plan safety stock for production. Pricing bands: expect per-unit cost to drop steeply from sample to full reel; always calculate landed cost (unit + freight + duty + handling). Procurement actions: use cut-tape for prototypes, buy full reels when forecast supports it, and record cross-references in the BOM for rapid switchover. (Common Questions) — Frequently asked questions What environments are suitable for a 0603 20kOhm 1% resistor? Answer: Typical 0603 resistors perform well in standard PCB environments; choose parts with appropriate temperature range and moisture sensitivity ratings for harsh or high-humidity conditions. For precision analog applications, prefer low-TCR parts and validate after conformal coating if applied. How should procurement compare pricing for 0603 20k 1% resistor buys? Answer: Compare quotes using landed cost per unit, factoring unit price, freight, duty, handling, and expected assembly yield. Normalize prices to common reel sizes and include split-reel or cut-tape fees when evaluating prototype vs production costs. When is thin-film preferred over thick-film for 0603 20k resistors? Answer: Choose thin-film when lower noise, tighter TCR, and better long-term stability matter (precision analog, high-stability references). Thick-film is acceptable for general-purpose digital pull-ups and non-critical bias networks where cost is primary. 0603 20kOhm 1% Resistor Technical Procurement GuideREAD MORE
 -
 RC0402FR-070RL Specs & How to Use 0402 Jumper Safely2026-04-29 10:17:19 0Designers working in compact, high-density PCB layouts frequently face accidental opens, solder bridging, or thermal damage when using 0402 jumpers. This guide provides step-by-step, practical guidance to select, spec-check, place, and test RC0402FR-070RL safely, reducing rework and field failures. 1 — Basics: What RC0402FR-070RL Is and Why 0402 Jumpers Matter (background) Physical form & electrical role Point: A 0402 jumper is a chip-style zero-ohm component used as a configurable short on dense PCBs. Evidence: The 0402 (metric 1005) footprint measures roughly 1.0 mm × 0.5 mm and occupies minimal area. Explanation: Designers use 0402 jumpers for net routing, board option selection, and as removable links for test or EMI routing; as a 0 Ω thick-film chip resistor style jumper it behaves like a short with low parasitic inductance compared with wire links. Common applications and constraints Point: 0402 jumpers serve in prototypes, production routing options, and EMI paths but come with clear limits. Evidence: Typical constraints include limited continuous current, small solder fillet allowance, and tight footprint tolerances. Explanation: Use cases include routing across split planes or selecting sensor options; however, designers must respect current carrying limits (see specs), ensure pad geometry supports reliable filleting, and maintain precise pick-and-place registration to prevent tombstoning or opens. 2 — Key Specs Breakdown: Electrical, Mechanical & Thermal (data analysis) Electrical Parameters Nominal Resistance0 Ω Max DC Resistance Power Rating~0.063 W Mechanical/Reflow Case Size0402 (1005 Metric) Peak Reflow235–260 °C Placement Accuracy±0.05 mm Electrical specifications to verify Point: Verify resistance behavior, current rating, and power limits before adopting RC0402FR-070RL in a circuit. Evidence: A 0 Ω jumper shows near-zero DC resistance; typical 0402 chip resistors of this size have conservative power ratings (~0.06 W) and practical continuous current in the low hundreds of milliamps. Explanation: For design margins, treat the jumper like a short with expected DC resistance under 0.05 Ω; for continuous traces, design traces and derate currents (for example target ≤200–300 mA) or use alternate jump methods for higher current paths. Always confirm exact specs from the part datasheet for final validation. Mechanical & thermal specifications to check Point: Mechanical fit and thermal exposure during reflow are frequent root causes of failure. Evidence: The 0402 nominal body is ~1.0 × 0.5 mm; recommended land patterns typically maintain 0.2–0.4 mm pad overhang and controlled paste volumes. Reflow peak for lead-free assemblies normally ranges 235–260 °C with time above liquidus 30–60 seconds. Explanation: Confirm exact dimensions, pad clearances, and the component’s maximum reflow temperature from the datasheet; use conservative paste percentages and follow moisture and handling guidance to avoid tombstoning and delamination. 3 — How to Choose the Right 0402 Jumper for Your Design (method / selection guide) Selection checklist (practical decision flow) Point: A short checklist speeds correct part selection and reduces iterations. Evidence: Match the part footprint to PCB pad geometry; confirm current, power and environmental derating; evaluate tolerance and lifecycle needs. Explanation: Decision rules — use a 0 Ω 0402 jumper when board area is constrained and expected current ≤300 mA; choose alternative jumpers (wire link, larger zero-ohm resistor) when higher continuous current, repeated field rework, or mechanical robustness is required. Document specs and approval criteria before layout freeze. PCB footprint, stencil and soldering considerations Optimization Tip: Stencil apertures typically use 60–70% of pad area and 0.1 mm thickness for controlled paste. Point: Land pattern and paste volume materially affect yield for 0402 jumpers. Evidence: Recommended pad sizes often range near 0.6–0.8 mm length with 0.4–0.5 mm width per pad. Explanation: Use slightly reduced paste area on one pad to reduce tombstoning risk, keep solder mask defined land outlines, and ensure fiducials and pick-and-place fiducials ease reliable placement; common mistakes include oversized pads and equal paste on both pads leading to tombstoning or bridging. 4 — Safe Handling, Placement & Soldering Procedures (method / execution) Pick-and-place and reflow best practices Point: Precise placement and conservative reflow profiles prevent opens and thermal damage. Evidence: Use a small nozzle (≈0.7–1.0 mm) and target placement accuracy within ±0.05 mm; reflow ramps of 1–3 °C/s, soak if required, and peak 235–260 °C. Explanation: Monitor oven soak and peak to avoid overheating; ensure machine vision confirms center alignment before reflow and reduce paste by 10–20% when tombstoning risk is observed. Inspection, in-circuit testing, and repair Point: Define visual and electrical acceptance criteria to speed inspection. Evidence: Visually, both pads should be wetted with smooth fillets; electrically, a 0 Ω jumper should read below ~0.05 Ω on a four-wire meter. Explanation: For repair use hot air (targeted ~320–350 °C nozzle surface) or fine-tip soldering with ESD controls; discard jumpers that show substrate cracks or discoloration. Log rework steps and retest continuity after repair. 5 — Failure Modes, Troubleshooting & Practical Use Cases (case + action) Common failure modes and root-cause checks Point: Opens, cold joints, bridging, and thermal degradation are typical failures. Evidence: Visual inspection often reveals insufficient fillet or excess paste; continuity testing differentiates opens from high-resistance joints. Explanation: Follow a quick checklist: visual inspection → continuity check ( Practical examples and quick action checklist Point: Real-world scenarios require tight, repeatable actions. Evidence: For prototype option changes, use consistent handling and inspect after each reflow. Explanation: Do: store components in controlled reels, inspect every 50 boards during process ramp, and verify continuity. Don’t: use oversized solder volumes, skip alignment inspection, or expose parts to repeated excessive heat. Summary (conclusion & call to action) Verify RC0402FR-070RL specs early in the design, match footprint and paste to prevent tombstoning, control reflow profiles, and apply defined inspection thresholds to reduce field failures. Action: update your layout rules to include conservative pad and stencil settings, set continuity acceptance (≤0.05 Ω) for jumpers, and document repair flows. Key Summary Confirm key specs early: verify resistance behavior, power rating (~0.06 W), and continuous current limits. Optimize footprint and paste: use slightly reduced paste area (60–70% aperture) and pad sizes near 0.6–0.8 mm length. Control reflow and handling: target peak 235–260 °C, 30–60 s above liquidus, and follow ESD-safe removal procedures. FAQ How low should resistance read for a 0402 jumper during testing? Answer: A properly soldered 0402 jumper should measure very low DC resistance; use a four-wire or low-resistance meter and expect values below about 0.05 Ω. Standard bench multimeters may not resolve milliohm differences, so establish continuity thresholds and use Kelvin measurements for critical low-resistance paths to avoid false positives. What footprint and stencil specs minimize tombstoning for 0402 jumpers? Answer: Use pad lengths around 0.6–0.8 mm and pad widths around 0.4–0.5 mm with a stencil aperture sized to deliver roughly 60–70% of pad area at ~0.1 mm stencil thickness. Intentionally reducing paste on one pad by 10–20% can reduce tombstoning; validate with a prototype run. What are safe removal and replacement steps for a failed 0402 jumper? Answer: Use a hot-air rework station with preheat and a focused nozzle, keep local temperatures within component limits, and use ESD controls. Remove solder with minimal mechanical force, clean residue, place replacement with proper paste, and reflow using the established profile. If the component substrate is damaged or shows discoloration, replace the component rather than reuse it.READ MORE
Subscribe to us!
Popular Posts
- Technical Features of PMIC DC-DC Switching Regulator TPS54202DDCR
- STM32F030K6T6: A High-Performance Core Component for Embedded Systems
- MAX3232CPWR Performance Report: Real RS-232 Specs & Insights
- 74HC123PW Complete Specs & Datasheet Quick-Reference
- SN74HC126PW Availability: Technical & Stock Snapshot
- SN74HC126PW Datasheet Deep Dive: Key Specs & Tests
- MAX96712GTB/V+T Availability and Pricing: Market Report
- ADS1015 ADC Deep Specs Report: Pinout & Performance
- Marvell 88SE9235A1 Deep Specs & Real-World Benchmarks
- STM32F103C8T6 Blue Pill: Benchmarks & Field Results


{{ boxName }} ({{ dataList?.length || 0 }} Items)
{{ val.part_number }}
{{ val.manufacturer || val.en_manufacturer || '' }}
quantity: {{ val.quantity }}
it was empty.